Hindsight is 2020


2020 was … well, it was a year. As we look forward to the great things coming in 2021, let’s take a moment to look back at some of the way our customers used Nexd last year! We’ve pulled together some of the stats we find most interesting and fun.
Important note! While these numbers are accurate, they aren’t necessarily showing the full picture. To borrow a line from statistics: correlation doesn’t equal causation. If in-stream impressions are low, that doesn’t mean in-stream ads don’t work – it may just mean we didn’t have very many last year! If you have follow-up questions, please be sure to talk with your account manager and we can help give context around these numbers.
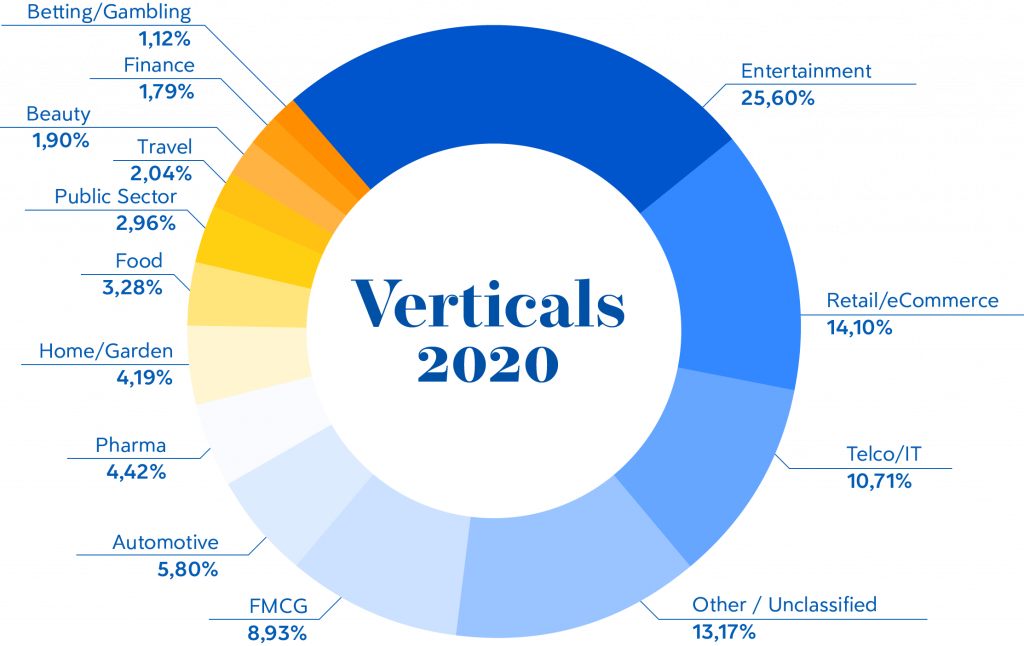
A breakdown of live creatives, by vertical:
A breakdown by placements
Creatives made by device:
18% desktop
82% mobile
Impressions we served were on:
11% desktop
85% mobile
4% in-stream
Layout with most impressions:
Desktop – Carousel
(79% of all desktop impressions)
Mobile – 3D Cube
(49% of all mobile impressions)
Layout created the most:
Desktop – Roller
(33% of all desktop creatives)
Mobile – 3D Cube
(41% of all mobile creatives)
Interestingly — while Roller and 3D Cube were the top created overall,
in Q3 both Desktop and Mobile saw a huge spike in Carousel creatives!
It was the top layout used that quarter, by a wide margin!
Creatives with a video asset:
Desktop 90%
Mobile 85%
Most common placement size:
Desktop – 300×600
(67% of all Desktop creatives)
Mobile – 320×320
(35% of all Mobile creatives)